
“Education must enable one to sift and weigh evidence, to discern the true from the false, the real from the unreal, and the facts from the fiction.”
~ Martin Luther King, Jr.
Whether you’re working with students in a classroom or a machine learning algorithm housed on a computer, teaching to the test can have some serious unintended consequences.
Imagine this scenario-
You sign your teenager up for SAT-prep classes twice a week. They learn strategies on taking the test, drill concepts that are heavily covered on the exam and, at the end of every session, take a practice SAT built from previously-released test questions.
And all that preparation seems to pay off when your child scores a 1560 (out of 1600) on the actual SAT. You take them out to dinner to celebrate and promptly order a “My Child is An SAT Champion!” bumper sticker for your car.
So imagine your shock several months later when your child, now hundreds of miles away at college, calls to inform you that they have failed out of school. “What happened?,” you wonder, as you painstakingly peel the bumper sticker off. “I thought they knew what they needed to know in order to be successful.”
We expect scores to give us information not only about current mastery, but also about future performance.
So what DID happen? Well, all of that SAT prep taught your child how to excel on the SAT. As a result, they were accurate on the exam, but their narrow focus and rigidity in thinking meant that they struggled to generalize and apply their knowledge to novel situations that didn’t closely mirror what they had been trained on. So you ended up with a kid that excelled at one thing, yet failed when it really mattered.
And this same thing can happen when we’re working with data –
After spending hours painstakingly cleaning and prepping your training data, you start by fitting a linear regression model of a few of the most promising features. When you run the statistics, you note that R2 = 0.76, indicating that 76% of the variability in the dependent target variable can be described by the independent variables in your model. “Not bad,” you think, “But I know that I can bring that up more.”
You start by adding more features and you watch the coefficient of determination slowly tick up to 0.84. Still not satisfied, you apply some polynomial transformations to your predictors, squaring and cubing values to try to better match the slight curves you notice when you plot your data.
“Ah ha!,” you exclaim, when you see that R2 has reached a dizzying height of 0.97 and the target line on your graph sinuously weaves through most of the actual data points. You take yourself out to dinner to celebrate and promptly order a bumper sticker that reads, “My Model is Better Than Your Model.”
Then, the next day at work, you confidently feed the test data into your model, expecting sheer brilliance to come out. Instead, you see…
R2 = 0.42
Frustrated and confused, you stomp off to the parking lot, where you surreptitiously peel off your bumper sticker (you smartly went for vinyl this time). “I just don’t get it,” you think to yourself, “My model did so well on the training data.”
We expect models to give us information not only about current mastery, but also about future performance.
So what DID happen? By using so many predictors and making a complex model that ascribed importance to every little fluctuation in the data, you created a model that describes the training data very well but fell apart when asked to predict on new information. In essence, you taught to the test by teaching it complex rules for one situation that don’t readily apply to new situations. So you ended up with an overfitted model that excelled at one thing, but failed when it really mattered.
So what’s the solution?
Before we settle on the “sweet spot,” let’s first explore the other extreme –
Going back to our teenager example, let’s imagine them sitting in a math class where the teacher decides that instead of covering the entire Algebra 1 curriculum as expected, she will only teach her students 3 concepts all year. Not surprisingly, when these students take the End of Course exam (that tests the entirety of the curriculum), they all (consistently, at least) perform terribly. The students were not provided with enough information to make valid conclusions.
When it comes to data, this extreme happens when the model is too simplistic, ignoring many of the characteristics of the data. The model is off the mark, spitting out predicted values that are far away from the actual ones, much like a person lost in the woods trying to follow a vague and poorly-written set of directions. This underfitted model is so basic that’s it’s uninformative and ultimately useless.
We want to find a balance between being well-informed enough to make quality decisions and being flexible enough to apply this knowledge to novel situations.
The goal in child-rearing is to launch a child that has been exposed to enough information to build knowledge, but has also had the freedoms to learn how to think and act when they’re thrust into a new environment.
The goal in model-building is to to create a model that has been trained on enough information to recognize and quantify patterns, but is not too tightly leashed so that it can create meaningful predictions on data that it has never seen.
Bias vs. Variance
In data science, the term bias is used to describe the difference between the average prediction of the model and the true value. Basically, this is how far off the mark the model is. A model with high bias is not accurate.
The variance of the model is the average distance between each model prediction and the average prediction of the model. In simple terms, this is a measure of how consistent the model is. A model with high variance is not reproducible.
There is usually a trade-off between these two sources of model error.
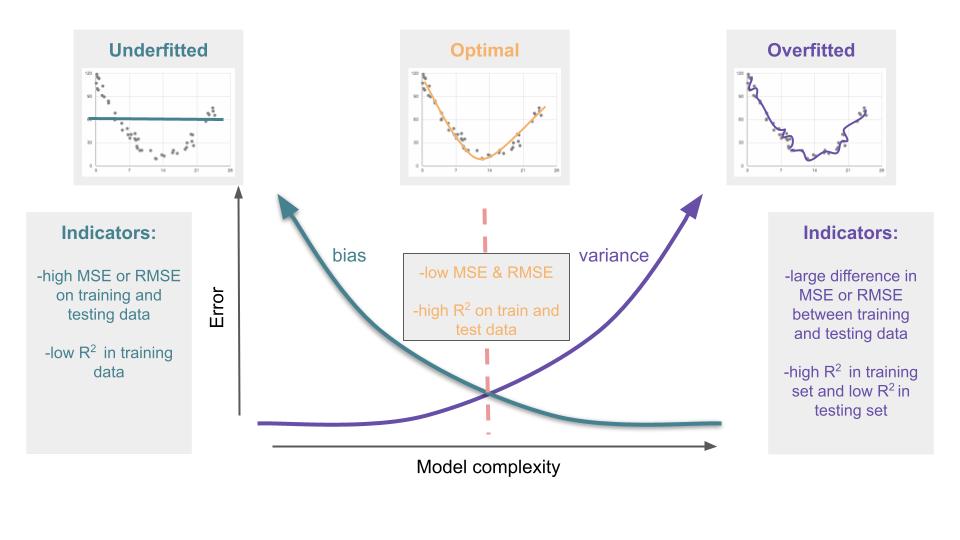
In practice, to find this sweet spot of optimal model complexity, create multiple models of varying complexity and use cross validation to find the one with the least amount of total error.
Unfortunately, there are no related processes that will assist with the raising of teenagers.

Lesson of the Day
I’ve learned about the assumptions for multiple linear regression: 1) linear relationship, 2) normal distribution of the errors, 3) homoscedasticity of the errors and 4) independence of the predictors AND how to test for these.

Frustration of the Day
My brain is so full of new information that I’m having trouble organizing all my thoughts and synthesizing the new knowledge.

Win of the Day
So it wasn’t today, but I got overall good feedback on my Phase 1 project. That was a BIG exhale.

Current Standing on the Imposter Syndrome Scale
4/5
The sheer volume of information to master is making me feel quite inept.
